Data Cleansing & Baseline
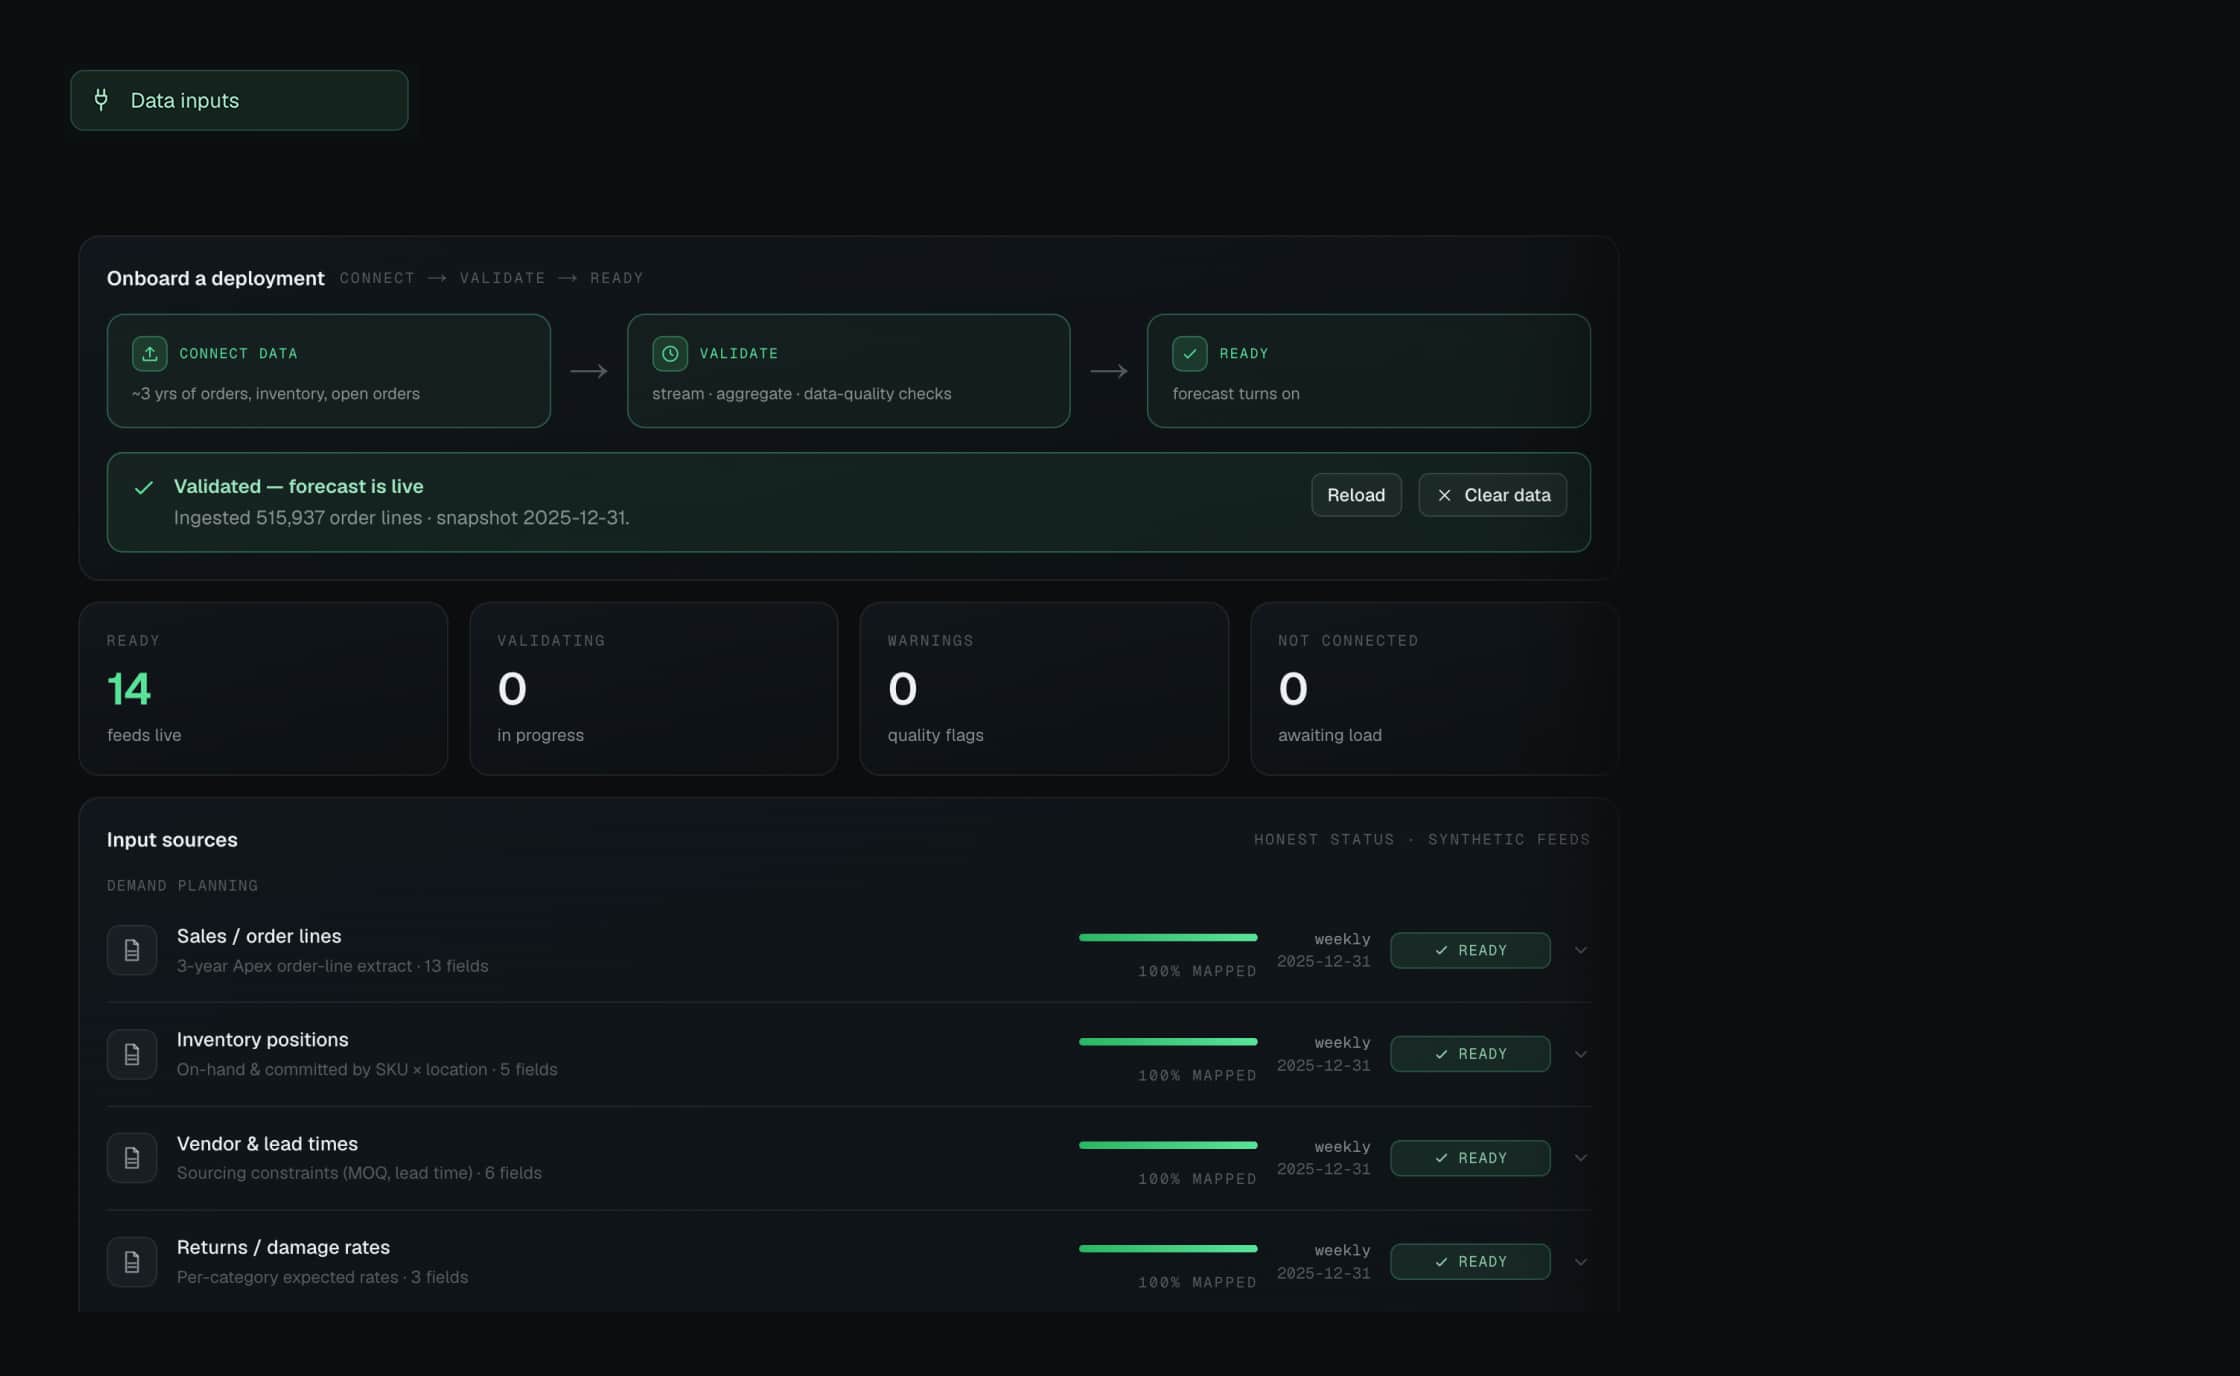
Over 60% of shipment mode records were missing. We reconstructed and enriched the dataset — expanding it from 15 to 22 structured fields — and established a clean, auditable baseline ready for optimization modelling.
Most operational improvement programs fail for the same reason: they separate diagnosis from execution. A consultant finds the problem and hands over a report. A software vendor deploys a tool and leaves. Neither is accountable for whether the margin actually moves.
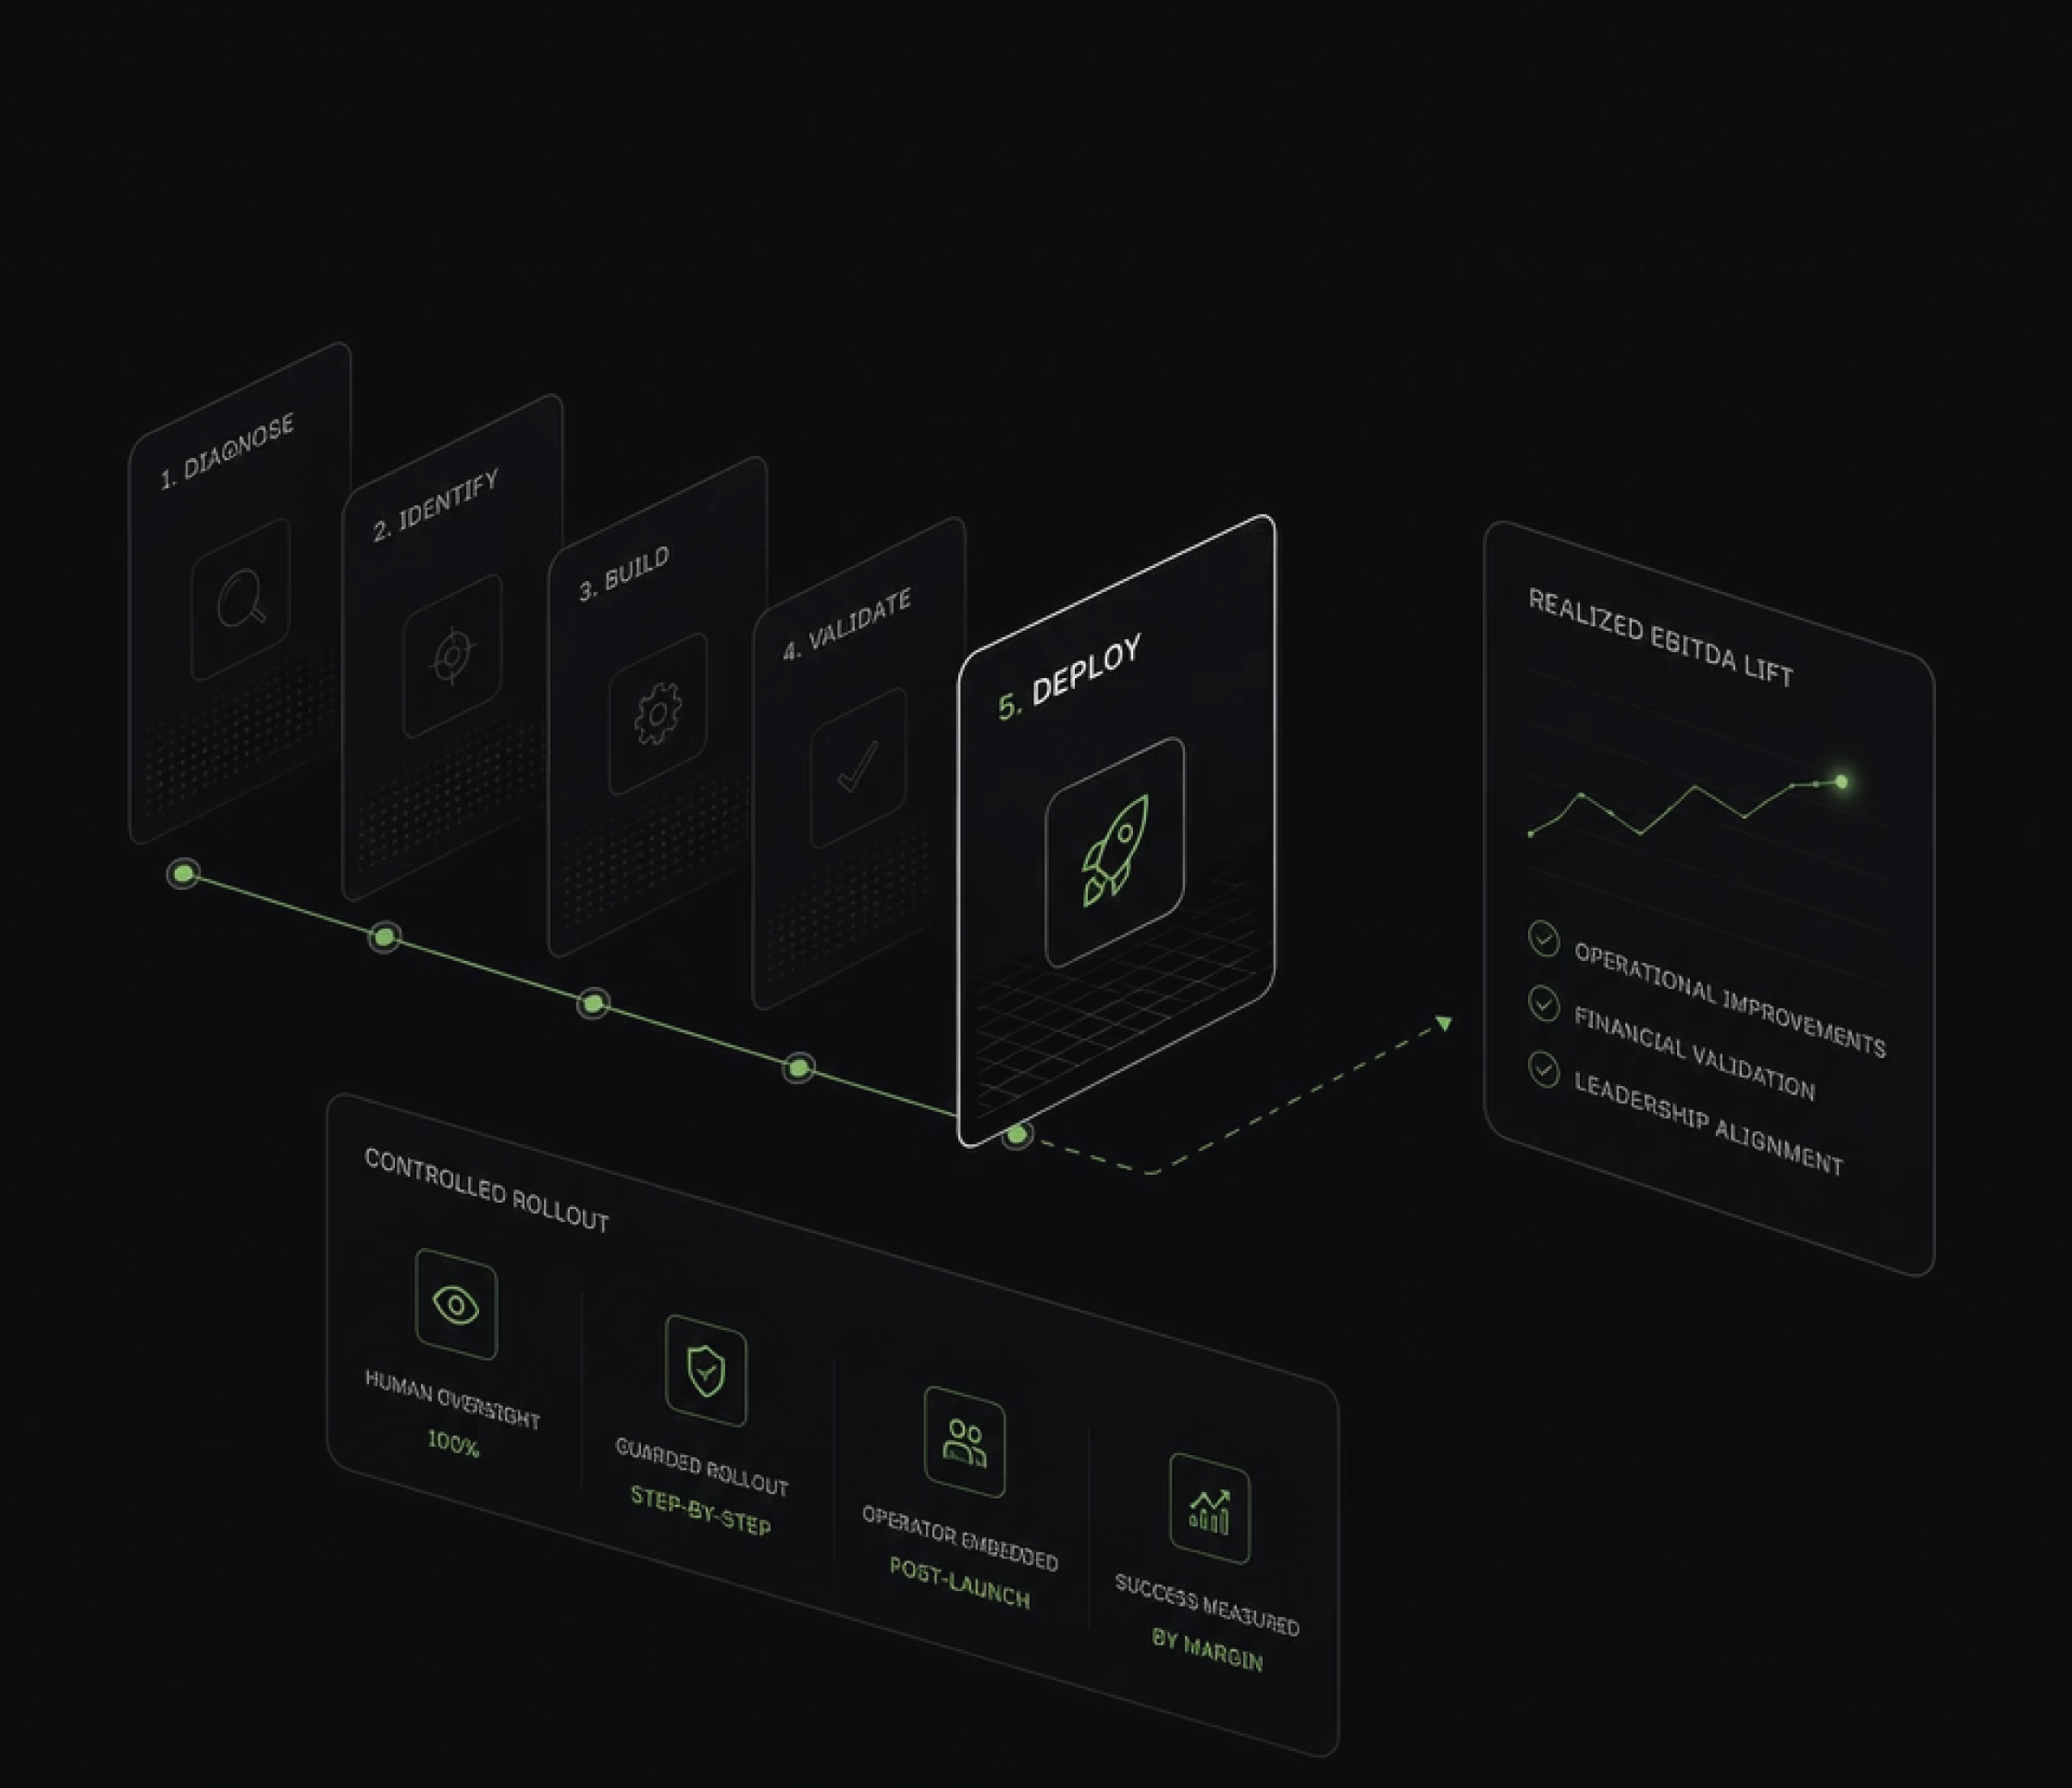
We embed as operators, not advisors. We build alongside your team, not above it. And we validate every dollar of improvement jointly with your operational and finance leadership before it counts toward our fee.

Accountability:
Fee tied to validated savings
Deployment:
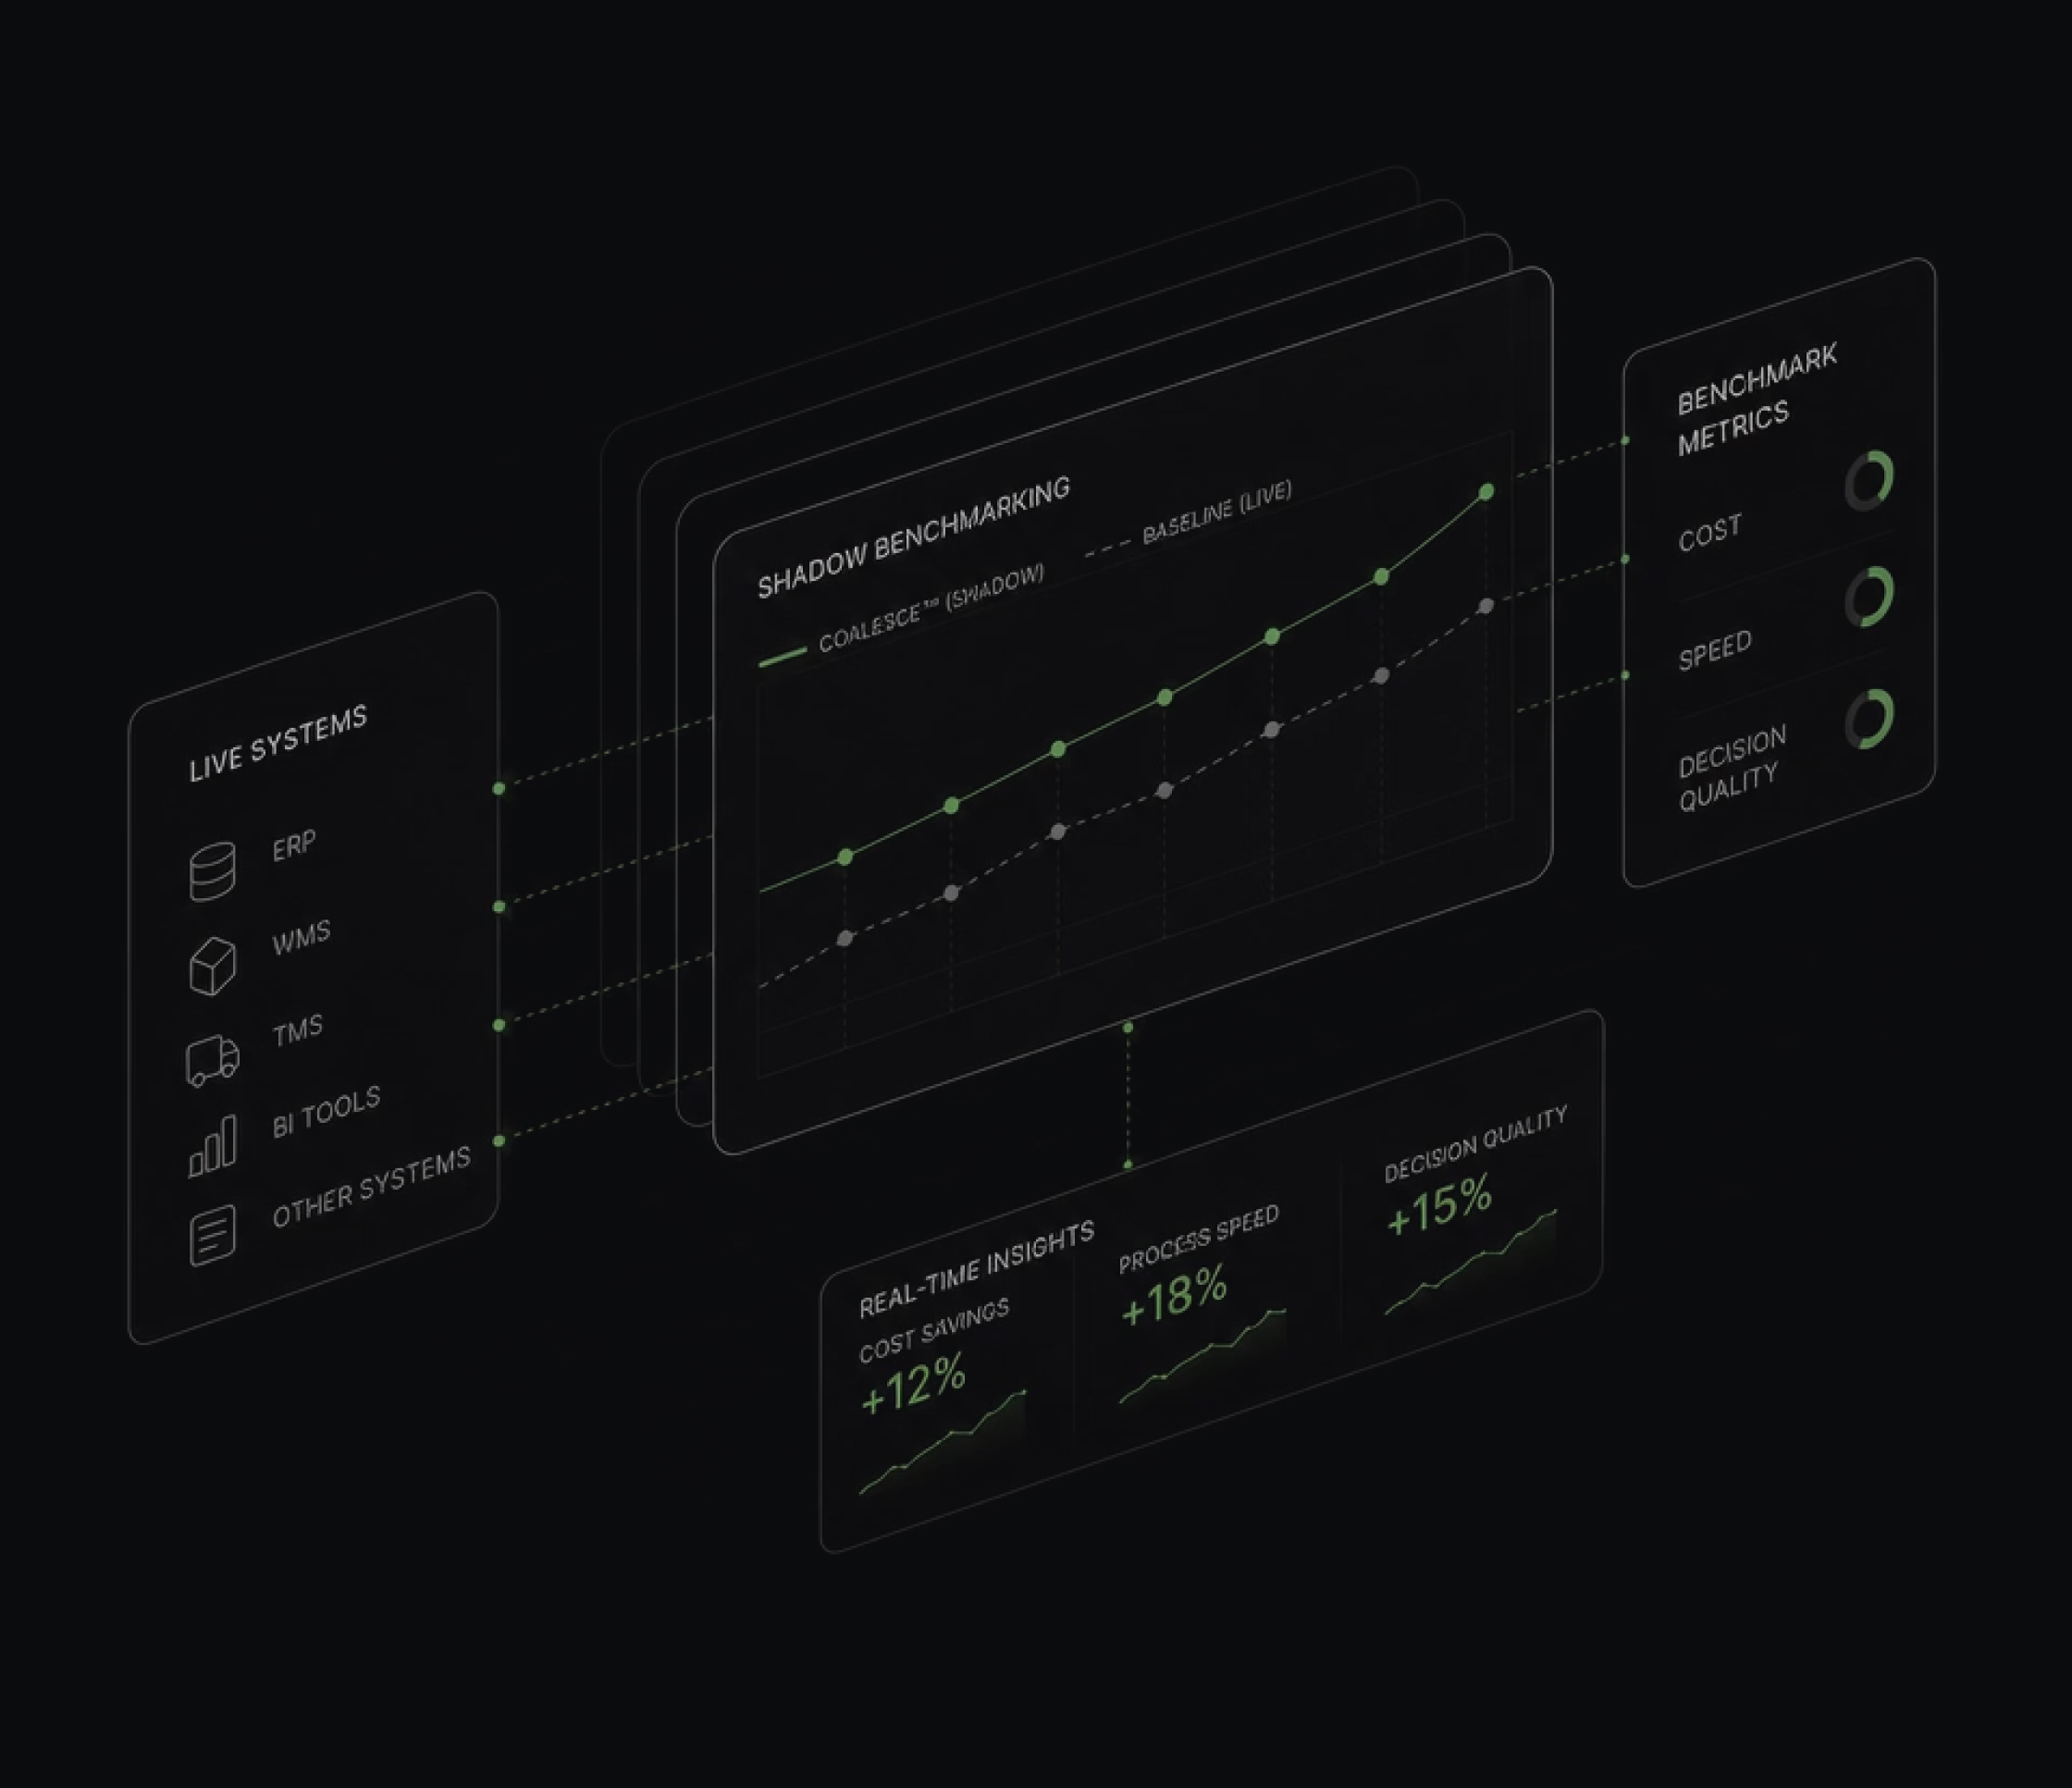
Embedded operators + parallel shadow testing
Disruption:
Zero. No system replacement
Time to Value:
Savings validated before full deployment
System Fit:
Integrates alongside existing infrastructure
Accountability:
Report or license - no skin in the game
Deployment:
Recommendations handed over, or a tool switched on
Disruption:
Often significant change management
Time to Value:
Often 12–18 months before results visible
System Fit:
Often requires proprietary stack adoption
Annualized margin silently leaks through manual micro-decisions in routing, pricing, capacity planning, and dispatch. Tens of millions of dollars annually across the operations we benchmark.
At a certain size, operational complexity becomes the enemy of margin. Here’s how the gap forms and why it stays invisible.
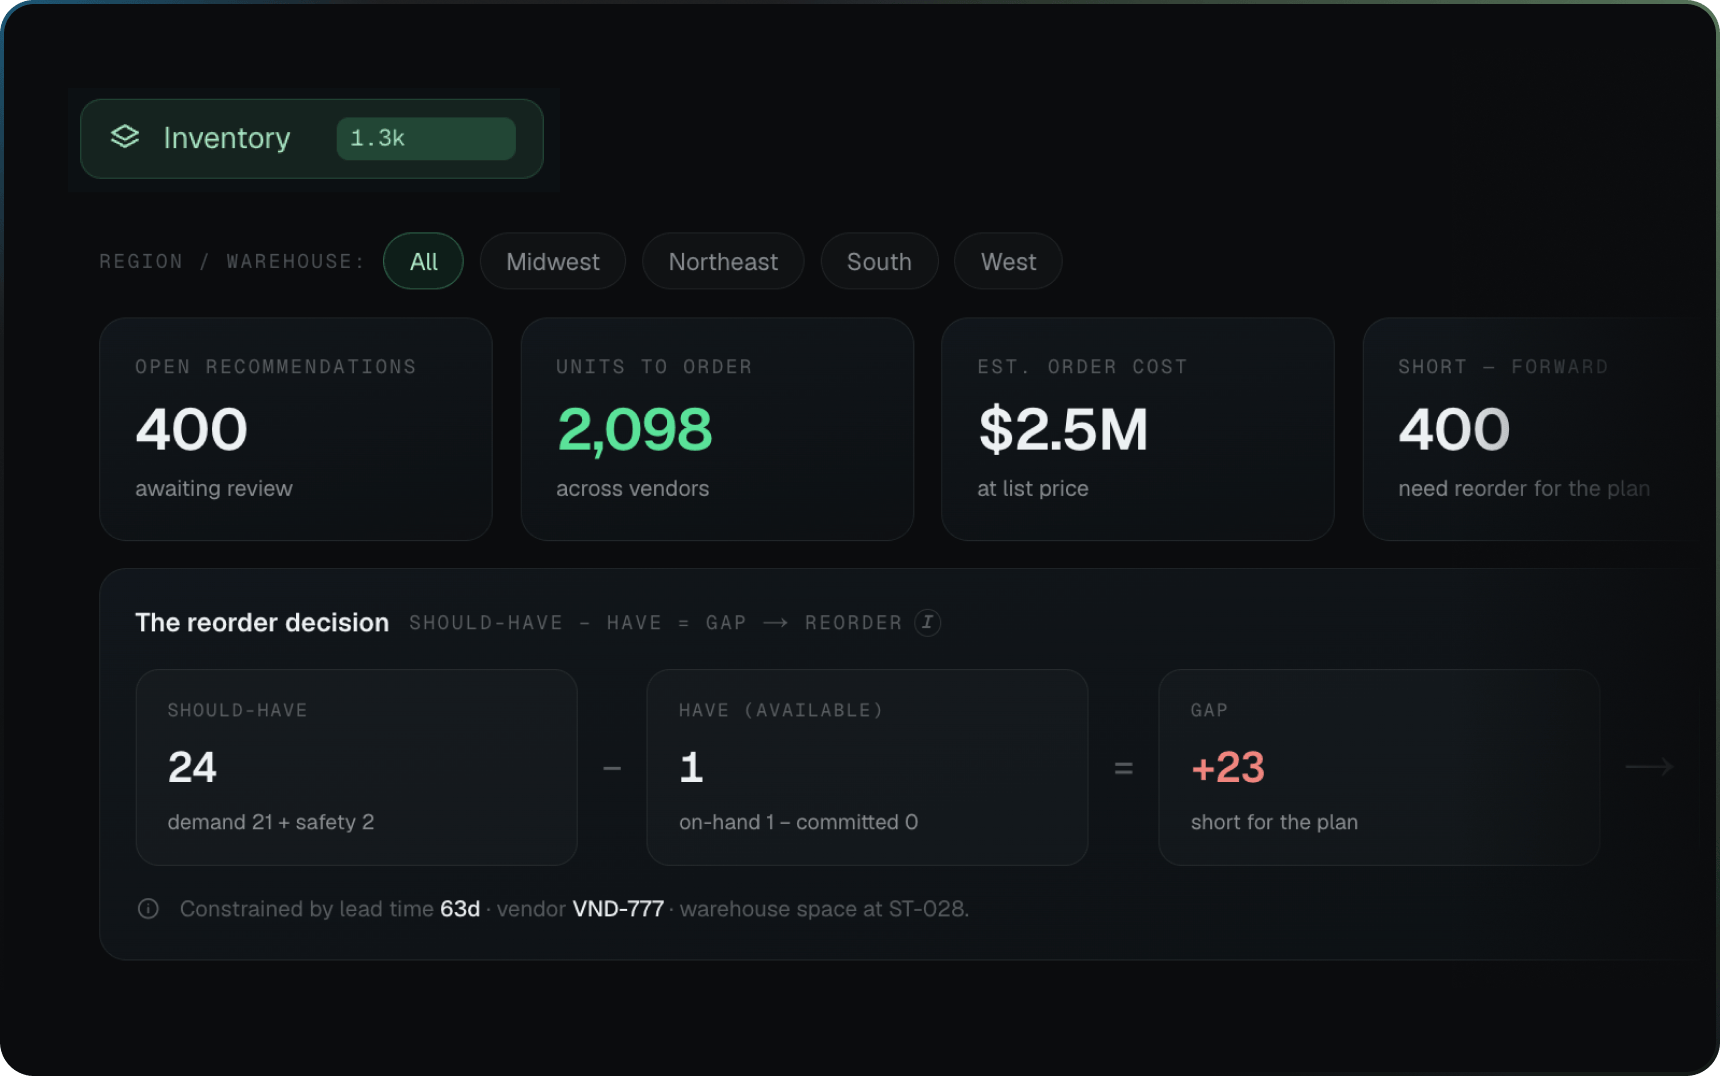
How to allocate resources. How to sequence work. How to match the right capability to the right demand at the right moment. In a complex operation, these decisions are made manually, locally, and in isolation by experienced people doing their best with the slice of the picture in front of them. Each decision looks reasonable on its own. The cost only appears in aggregate.
Industry benchmarks tell the story. The distance between how a business is performing and how it could perform is consistently worth tens of millions of dollars annually at scale a structural EBITDA opportunity, not an operational footnote.
Resource Utilization
First-Time Fix Rate
Dispatch Cycle Time
Labor Cost per Job
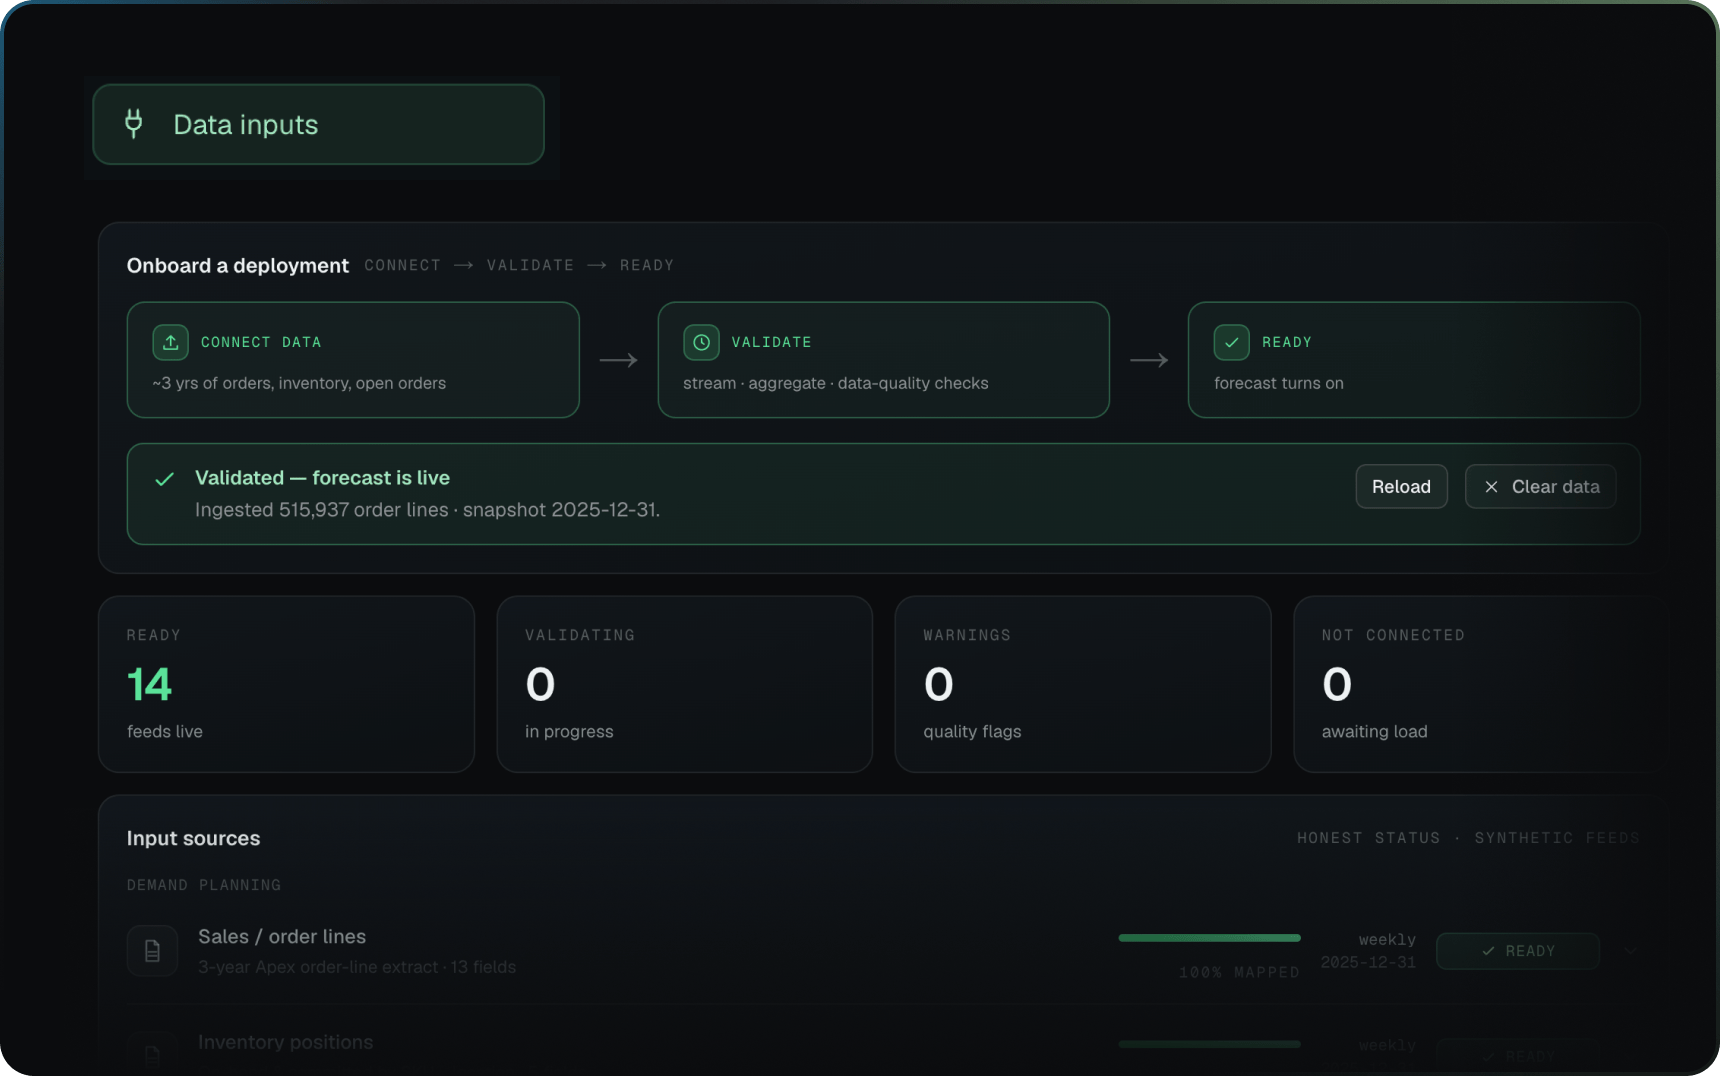
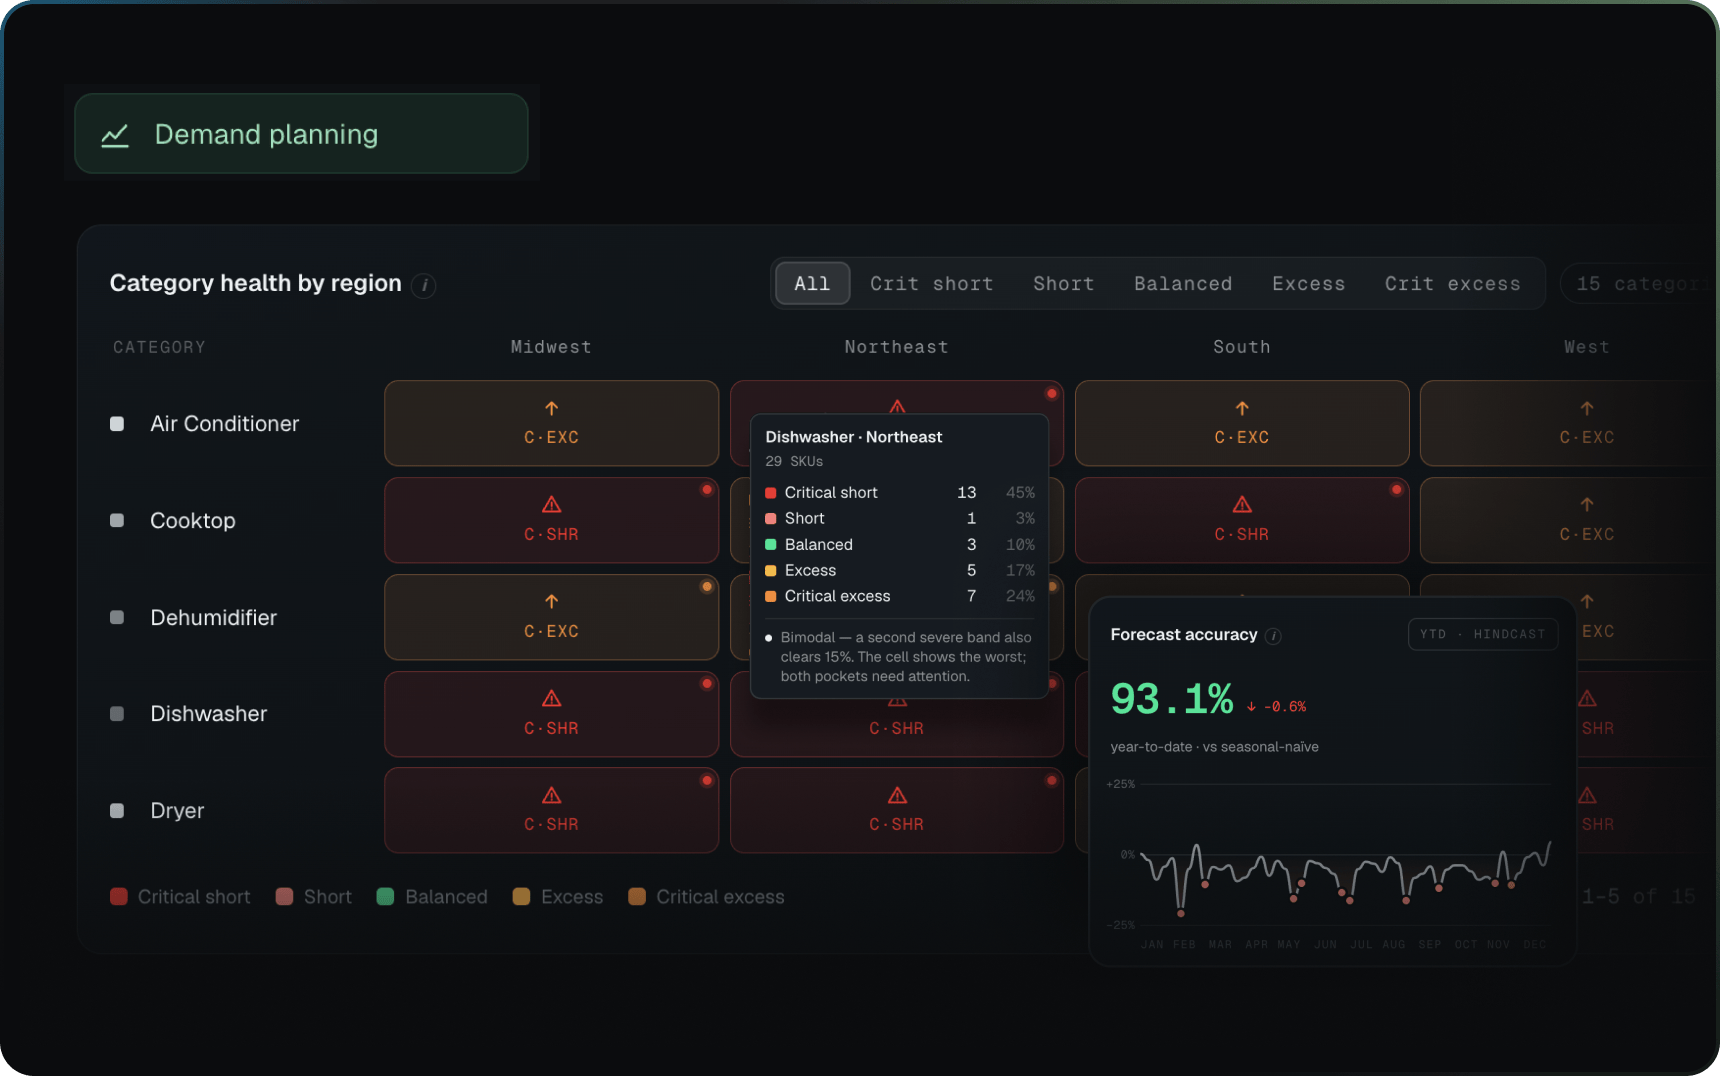
ERPs, dispatch platforms, and scheduling tools aresystems of record — they log what happened, not what should have happened. They can’t tell you whether the price you paid was good, whether the route was the best one available, or where utilization is quietly leaking. The data exists. The intelligence layer to act on it doesn’t.
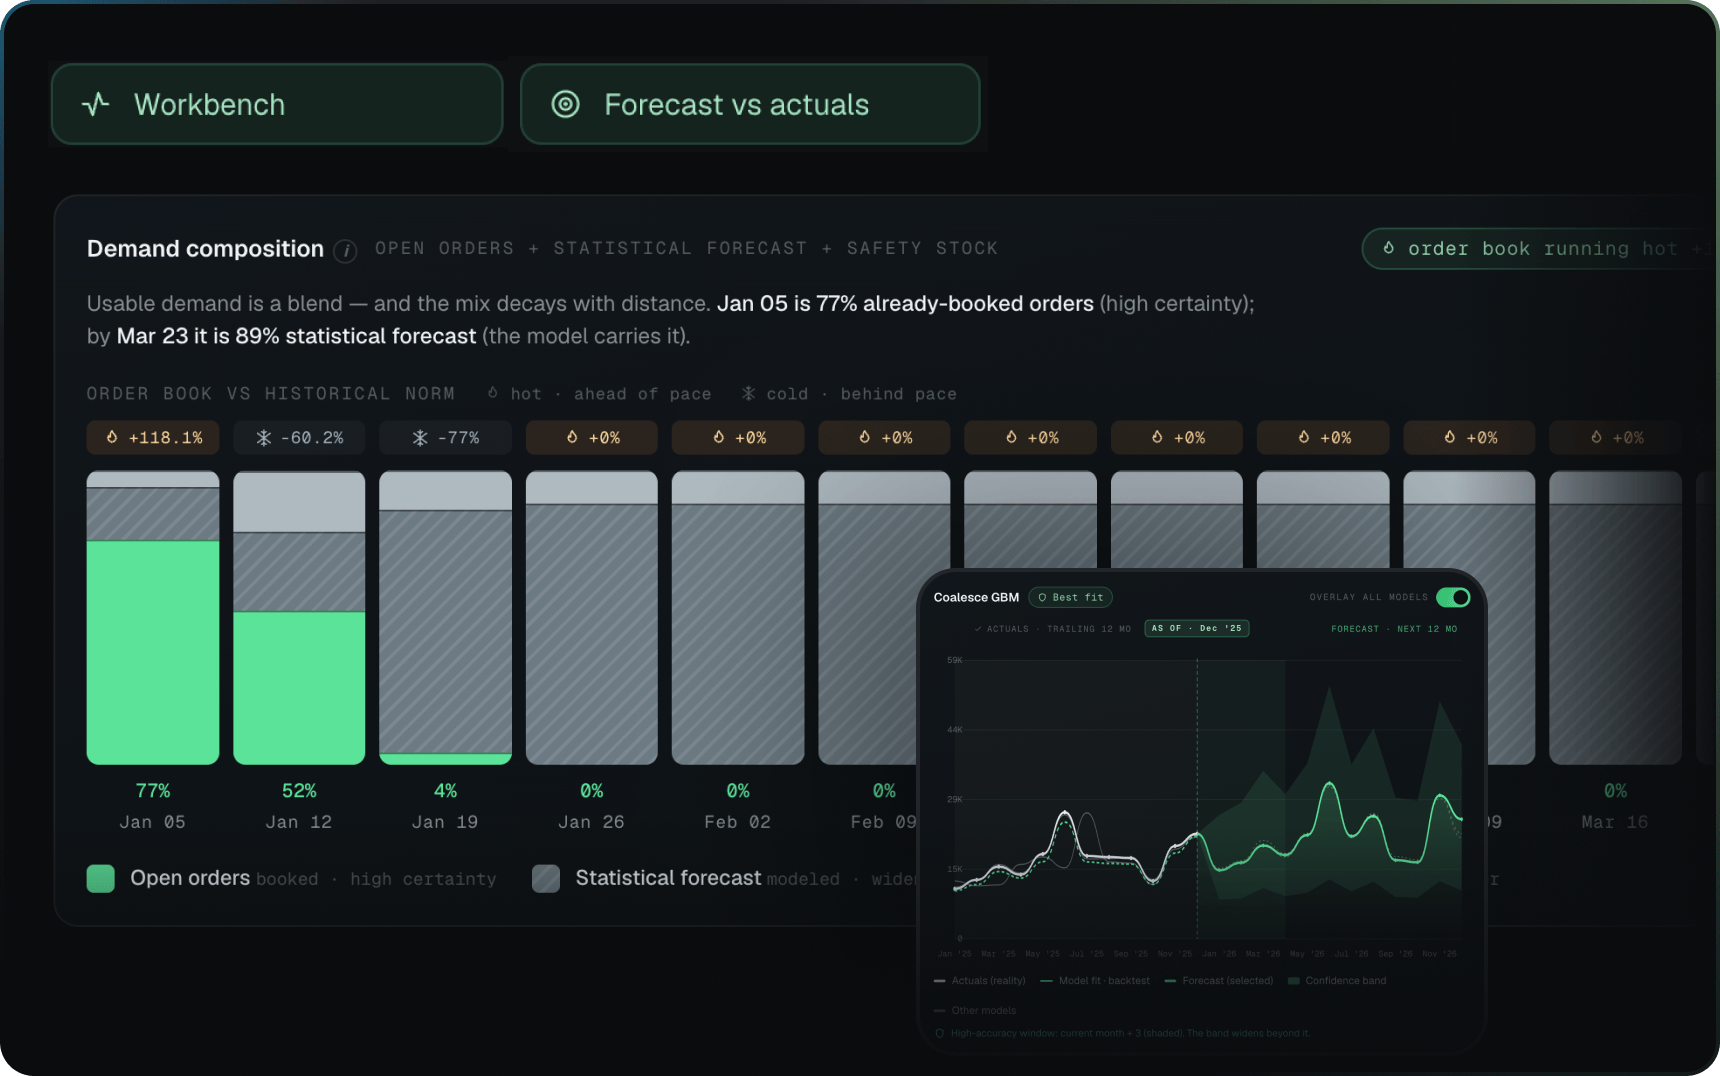
Operational inefficiency at scale isn’t static it compounds. Every new location, every added route, every season of peak strain widens the distance between current and possible performance. The businesses that outperform aren’t the ones with the most data. They’re the ones with systems that turn it into better decisions every day.
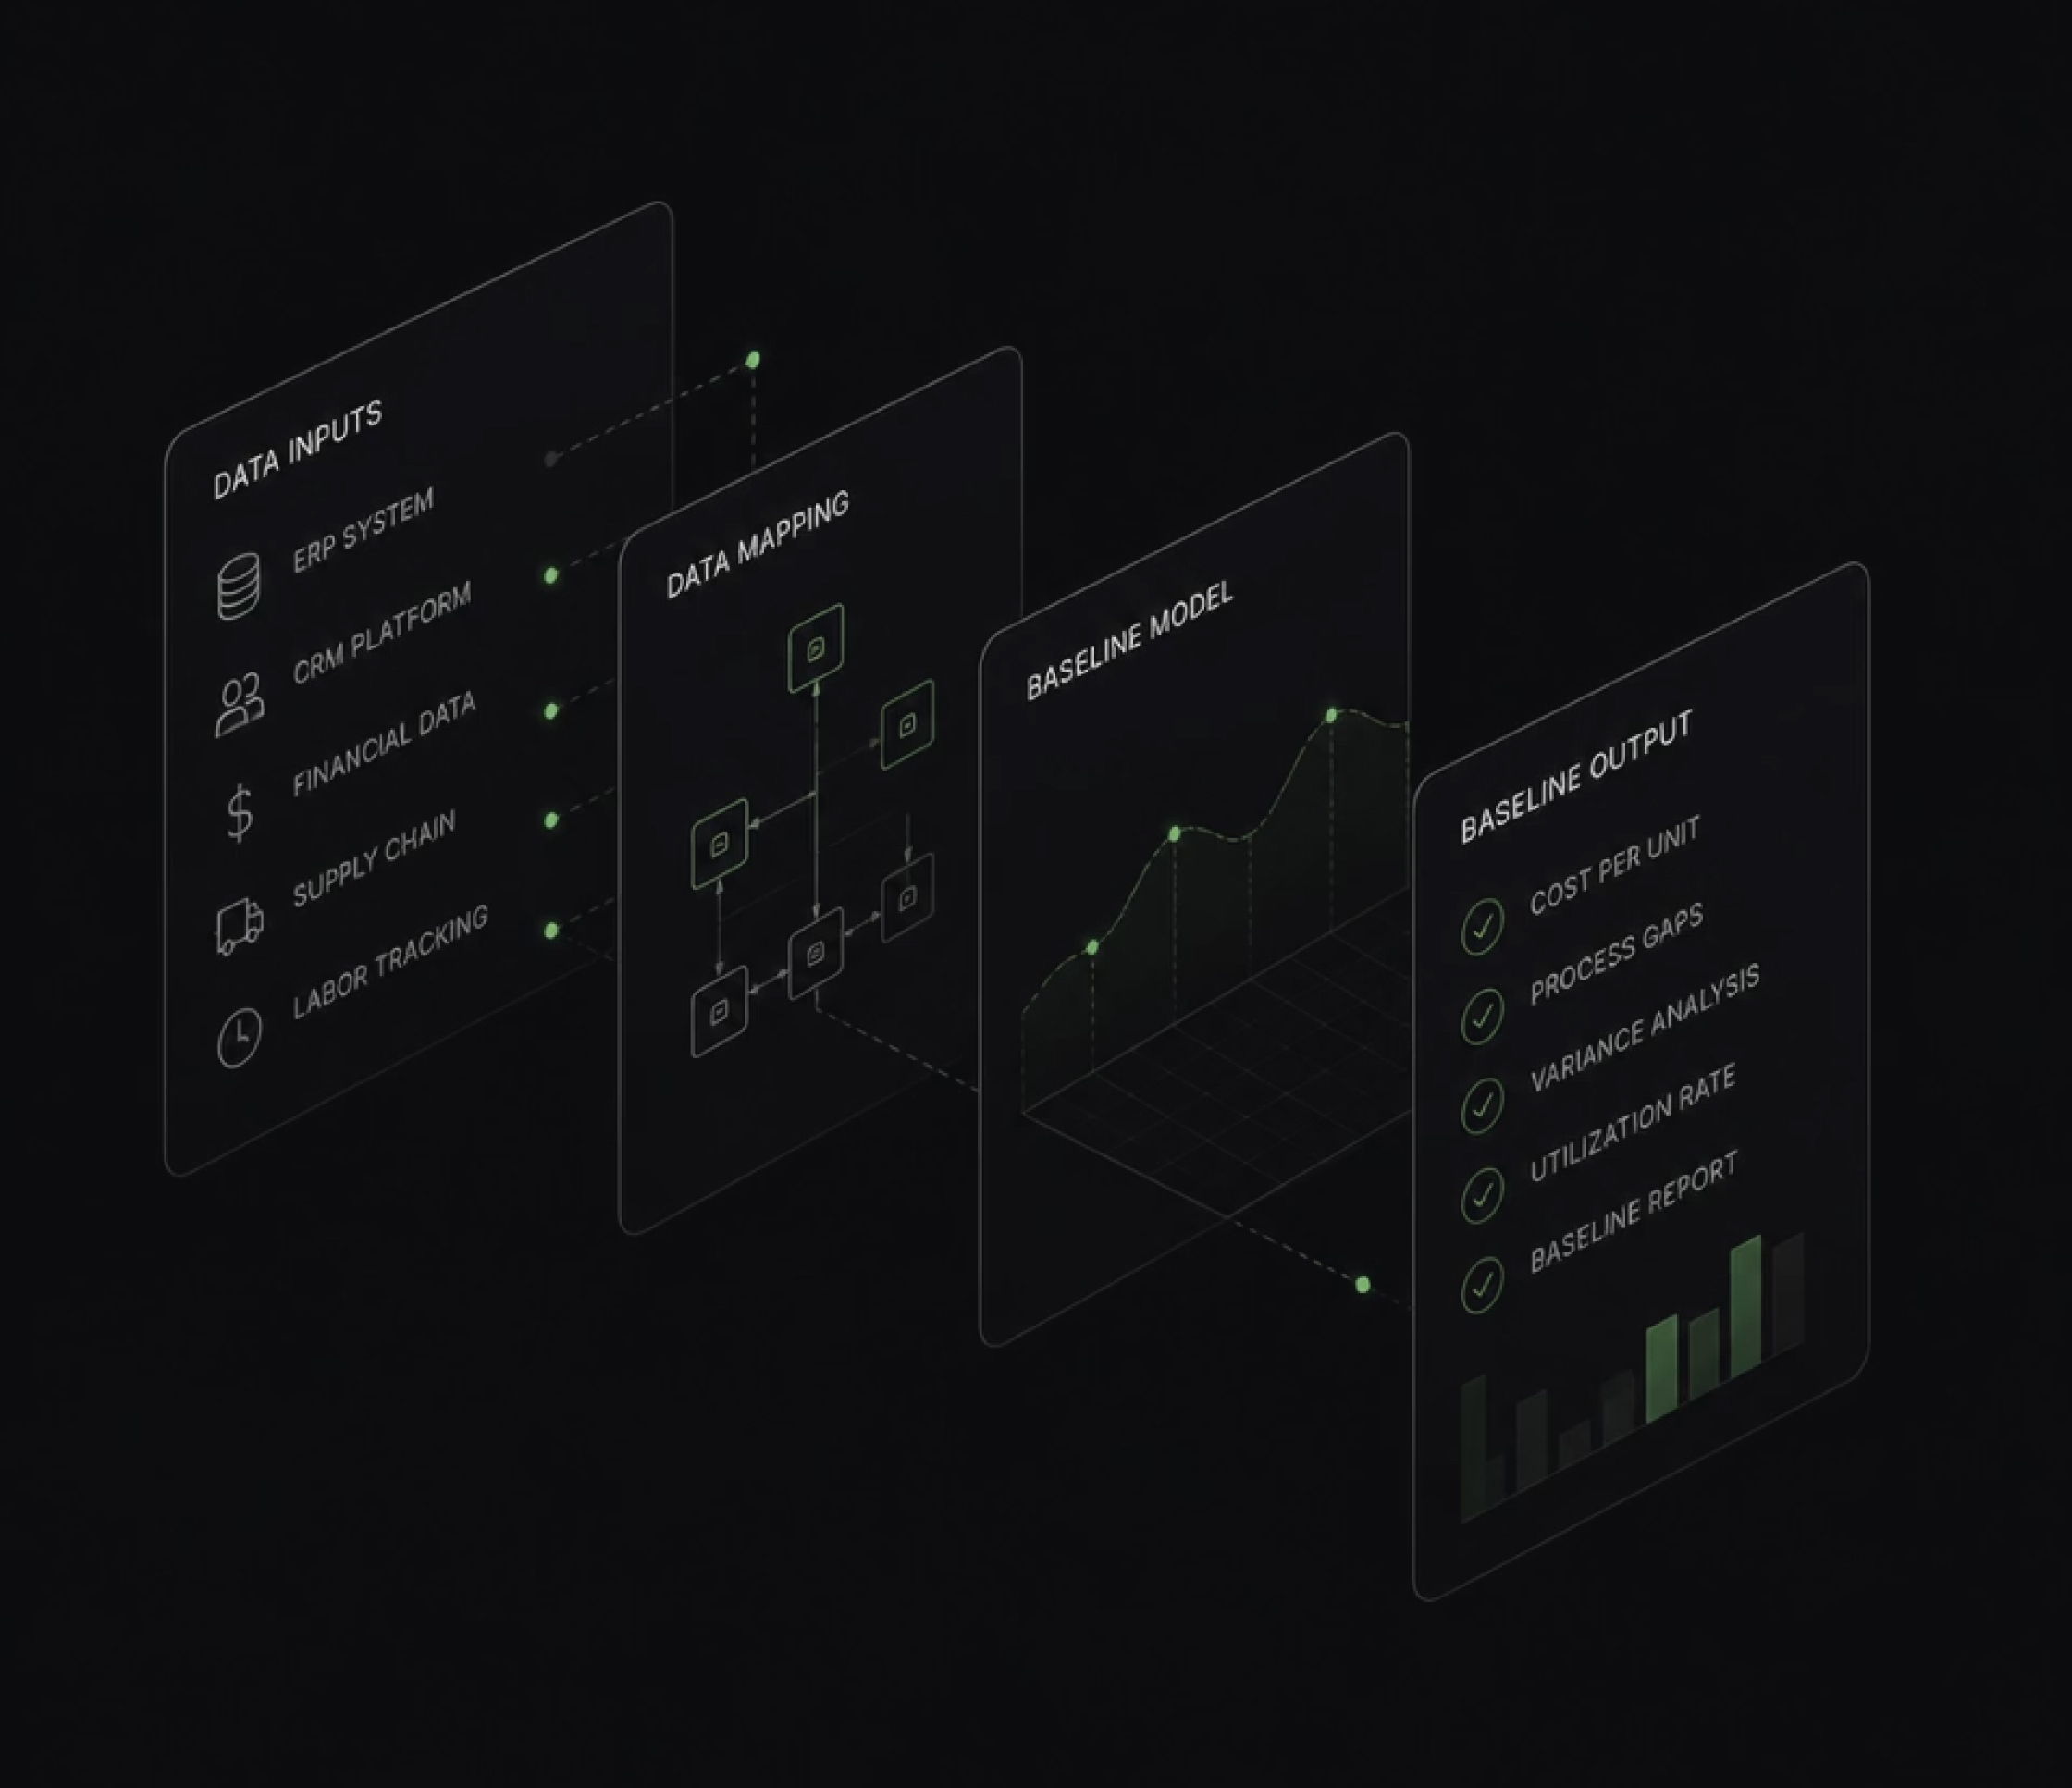
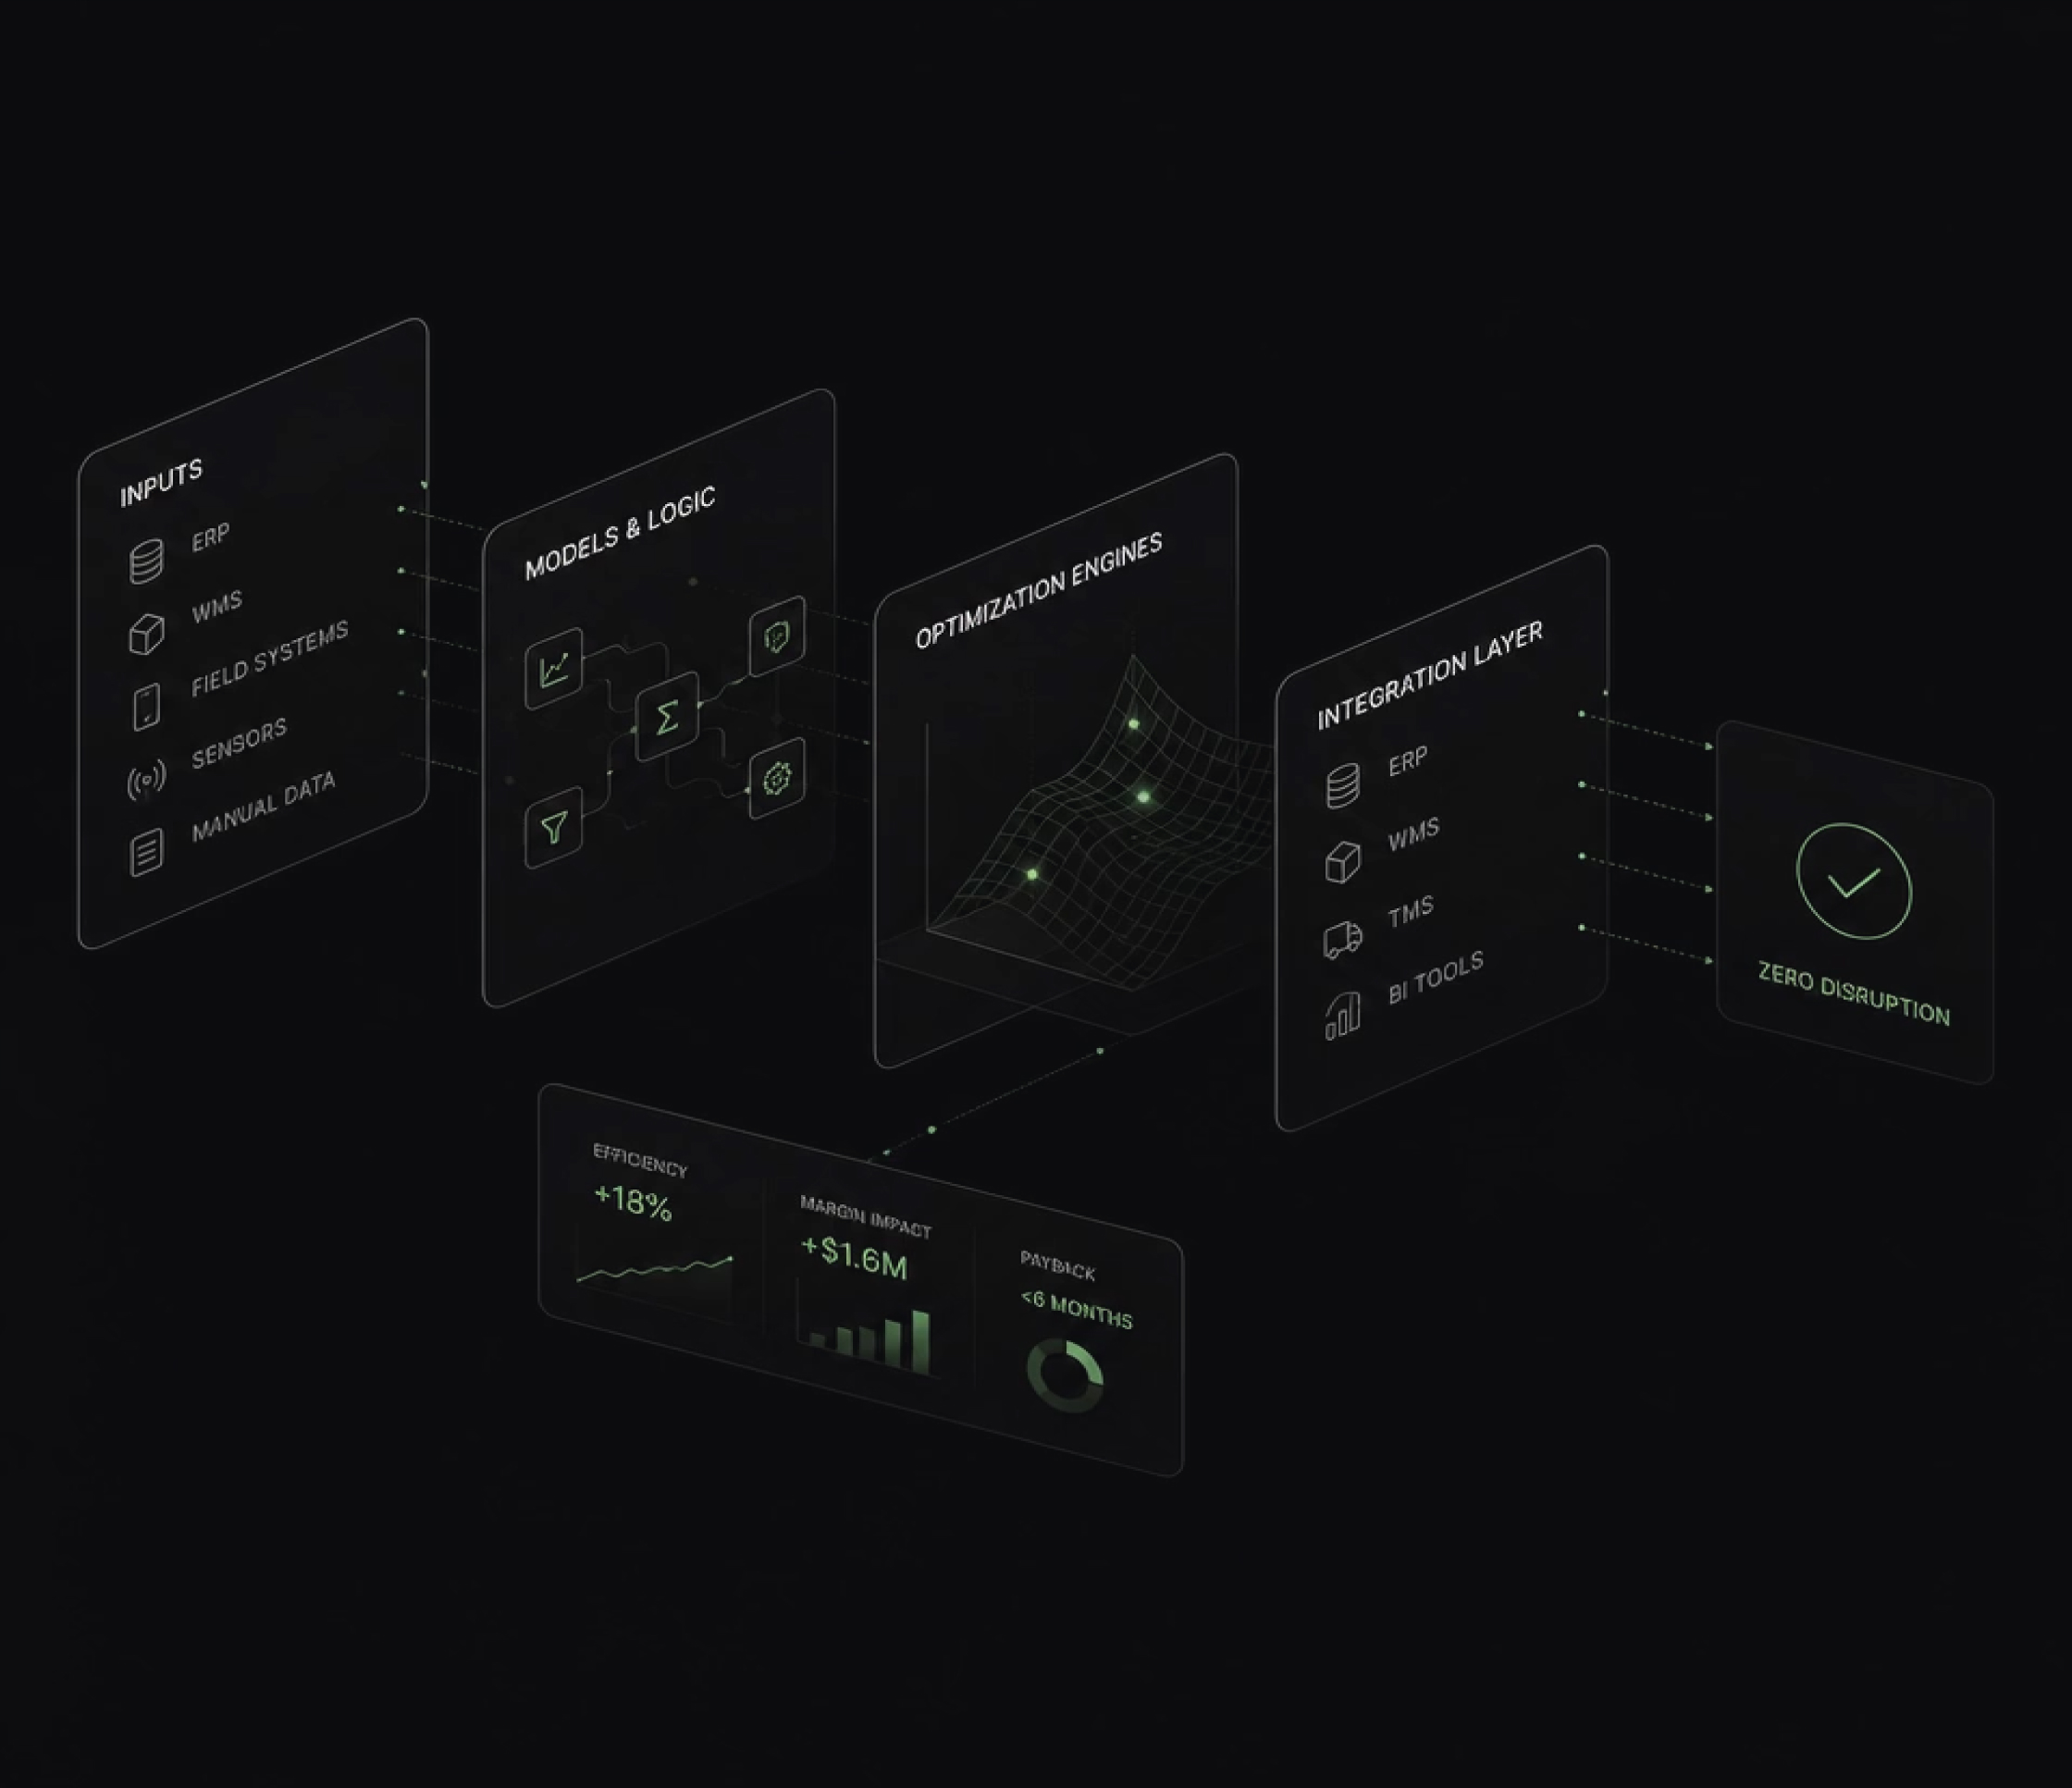
We find the margin that scale creates and manual operationscan’t recover then build the systems to capture it ermanently. We embed experienced operators directly inside the business to map workflows, quantify inefficiencies, and establish a precise baseline. That foundation feeds COALESCE™, which integrates alongside your existing infrastructure no disruption, no replacement.
A recent engagement with a Canadian freight distribution operator running 300,000+ annual shipments across a Canada–US network.
Over 60% of shipment mode records were missing. We reconstructed and enriched the dataset — expanding it from 15 to 22 structured fields — and established a clean, auditable baseline ready for optimization modelling.
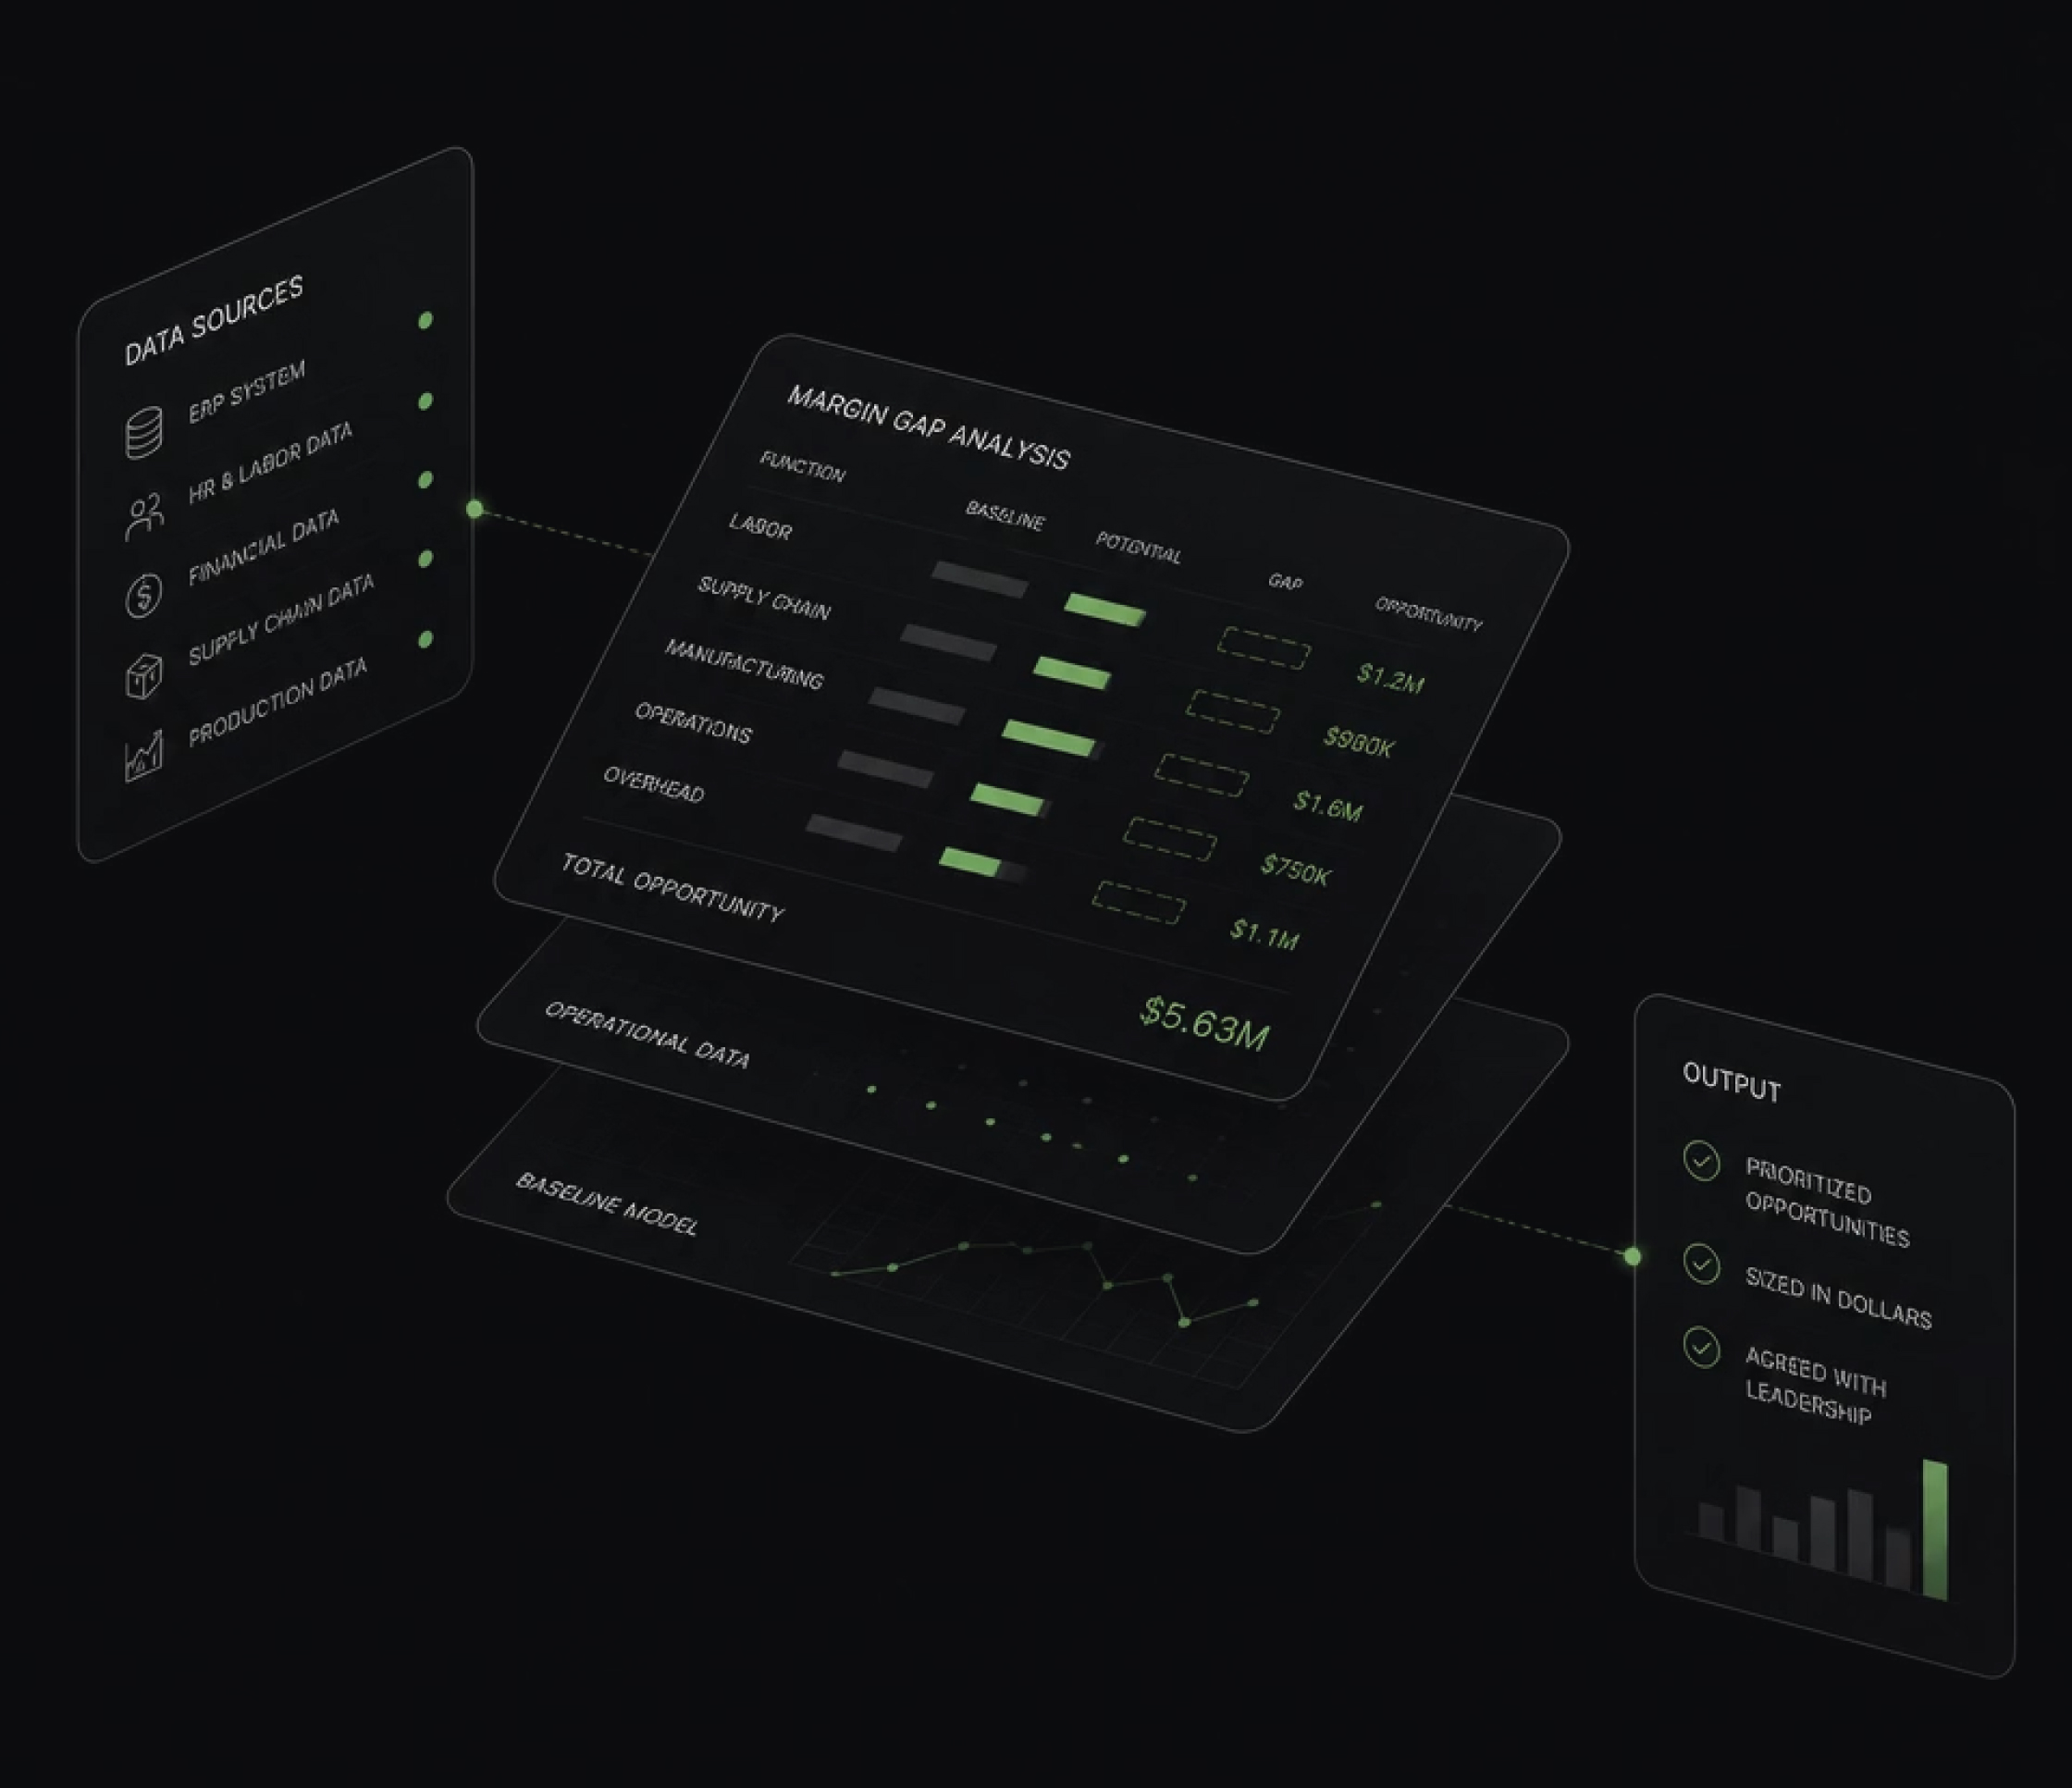
Spatial clustering and time-window logic identified consolidation candidates across the network. Up to 40% of shipments showed consolidation potential of $916,834 in validated annual savings.
Modelled rerouting US-bound shipments through a proposed Southern distribution centre. The NC scenario outperformed the Ontario origin across all four quarters with an additional $51,444, a 5.6% improvement over the already-optimized baseline.
Annual Shipment Cost
Nearly $1M in validated annual savings. Single client. Existing infrastructure. No disruption.
Meet the AlphaWerx Partners
Three operators across technology, finance, and commercial growth each with a track record of creating measurable enterprise value.
Over $300M in enterprise value created across 18+ years in private equity, family-owned businesses, and operational leadership. MBA from Kellogg Northwestern, LLM from Osgoode. Financial precision, legal acumen, and board room-to-floor operational depth.
24+ years in software engineering, enterprise architecture, and data analytics. MBA from Kellogg Northwestern. Specializes inaligning IT strategy with business outcomes using generative AI and next-generation technologies to drive enterprise value.
15+ years scaling consumer brands across APAC, LAR, and NAR. MBA from Kellogg Northwestern. Led over $175M in commercial revenue. Deep integration experience executing over $100M in incremental revenue roadmaps. Expertise in route-to-market strategy, change management, and sustainable value creation.